Trading decisions: What’s the “best” price to apply?
Learn Forex Trading
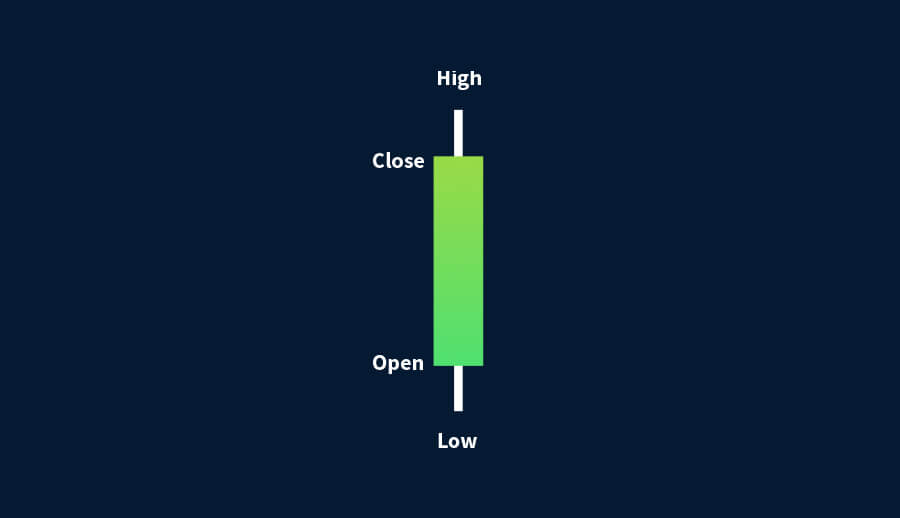
Traders who base their trading decisions on technical analysis tools will ultimately face a few dilemmas when it comes to choosing the “best” price to apply in their technical tools calculations. Since nowadays most traders use Japanese candlesticks to understand price on their price charts, it’s important to note that there are four obvious available prices: open, high, low and close. Of course, this is the bare minimum number of choices that a trader has on the candlestick chart. There are also many different possible combinations, making the selection of the “price” a potentially difficult task – especially for beginners.
Closing price
It is no secret that a lot of traders, beginners and professionals alike, consider the closing price to be the most useful. This perception is mostly driven by stock market traders who believe that the last price of the day captures everything needed to make informed trading decisions. This includes the day’s sentiment (based on economic releases, monetary developments, political stance and, inevitably, crowd psychology), and also reflects what is anticipated to happen before the next session of the market opens.
Even Charles Dow, often considered one of the “forefathers” of technical analysis, considered the closing price to be the most important price of the day. But how should those trading foreign exchange approach the closing price? Unlike the stock market, which is not open 24 hours and instead opens at a certain time in the morning and closes at a certain time in the afternoon, the foreign exchange market is open 24/5. It is a continuous market without any set opening and closing times!
What the foreign exchange markets offers instead of set opening and closing times are different timeframes. Each candlestick represents the price activity over an adjustable amount of time: namely, 1 minute, 5 minutes, 15 minutes, 30 minutes, 1 hour, 4 hours, 1 day, 1 week and 1 month. Forex traders can treat the close price at the completion of a candlestick in much the same way as stock traders do in the stock market.
Other price options
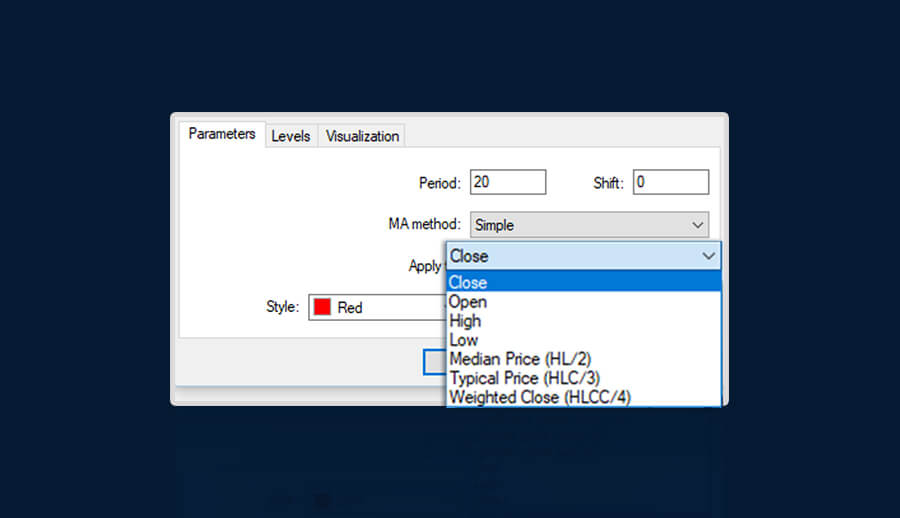
So, irrespective of the market that one trades, the question persists: what is the “best” price to use? For that reason, trading platforms offer a few choices:
- Open
- High
- Low
- Close
- Median
- Typical
- Weighted Close
One could argue that the choice is subjective, but I believe that there are cases where one price is better than another.
One way to choose the “best” price is by market convention. For example, in the stock market the majority of the traders observe the daily closing price, so it can often make sense to use it when calculating technical tools as well.
Open price
On the other hand, the open price represents the reaction of traders to any developments since the last close. The Market Profile methodology makes use of the open price to provide clues for market reactions.
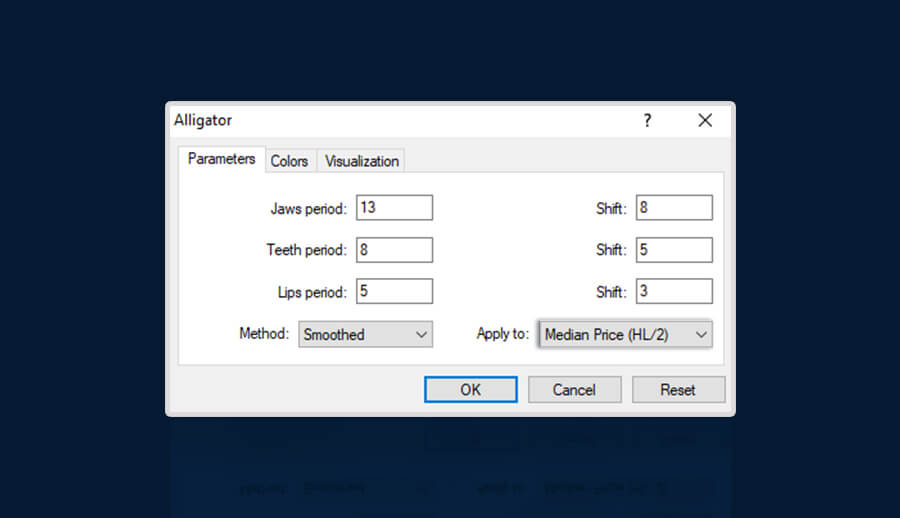
Median price
Traders can also choose the midpoint of a candlestick – that is, (high + low) / 2 – instead of relying on just one price; this is the median price. The Alligator indicator makes use of the median price to calculate the lips, teeth and jaws.
Typical price
Another way to account for the two extremes of prices during a session (high and low), as well as the closing price, is to use the typical price. The formula for the typical price is (high + low + close) / 3.
Weighted close price
Furthermore, since the closing price is considered by a respectable number of traders to be the most important, it is not surprising that the weighted close price is another popular choice when it comes to making trading decisions. For this, the formula is (high + low + close + close) / 4. It’s simple to see that there is more emphasis on the close price, compared to the rest of the prices. Moreover, support and resistance lines are drawn including the high or low price of a candlestick. Likewise, price confirmation of candlestick patterns observes the high and low price.
Therefore, when it comes to making trading decisions, there is no one “best” price to apply when calculating a technical tool or drawing a technical line or object. The choice may be indeed purely subjective. In other cases, it can be decided on market convention or based on just mathematics. The choice is yours!
More FXTM educational resources
Explore our comprehensive collection of forex education videos to discover more resources that may help you while making your trading decisions. We also host regular trading seminars around the world to give our clients the opportunity for hands-on practice under the guidance of our team of experts. Remember: a successful trader is an educated trader!
Disclaimer: This written/visual material is comprised of personal opinions and ideas. The content should not be construed as containing any type of investment advice and/or a solicitation for any transactions. It does not imply an obligation to purchase investment services, nor does it guarantee or predict future performance. FXTM, its affiliates, agents, directors, officers or employees do not guarantee the accuracy, validity, timeliness or completeness of any information or data made available and assume no liability for any loss arising from any investment based on the same.
Risk Warning: There is a high level of risk involved with trading leveraged products such as forex and CFDs. You should not risk more than you can afford to lose, it is possible that you may lose more than your initial investment. You should not trade unless you fully understand the true extent of your exposure to the risk of loss. When trading, you must always take into consideration your level of experience. If the risks involved seem unclear to you, please seek independent financial advice.
